2019.11.18 10:23
为了帮助大家高效备考雅思,新东方在线雅思频道为大家带来“两个图表混合的雅思作文如何答”,希望对大家雅思备考有所帮助。更多精彩尽请关注新东方在线雅思频道!
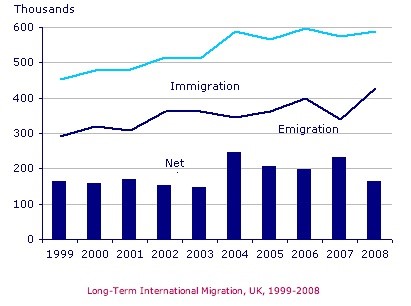
混合图:英国移民
The chart below shows long-term international migration in UK.
雅思作文范文
The chart gives information about UK immigration, emigration and net migration between 1999 and 2008. 这张图表提供了1999年至2008年间英国移民、移民和净移民的信息。
Both immigration and emigration rates rose over the period shown, but the figures for immigration were significantly higher. Net migration peaked in 2004 and 2007. 移民和移民率在这段时间内都有所上升,但移民人数明显更高。净移民在2004年和2007年达到顶峰。
In 1999, over 450,000 people came to live in the UK, while the number of people who emigrated stood at just under 300,000. The figure for net migration was around 160,000, and it remained at a similar level until 2003. From 1999 to 2004, the immigration rate rose by nearly 150,000 people, but there was a much smaller rise in emigration. Net migration peaked at almost 250,000 people in 2004. 1999年,超过45万人在英国生活,而移民的人数不到30万人。净移民人数约为16万人,直到2003年才达到类似水平。从1999年到2004年,移民率上升了近15万人,但移民人数却少了很多。2004年,净移民人数达到近25万人的峰值。
After 2004, the rate of immigration remained high, but the number of people emigrating fluctuated. Emigration fell suddenly in 2007, before peaking at about 420,000 people in 2008. As a result, the net migration figure rose to around 240,000 in 2007, but fell back to around 160,000 in 2008.(159)
2004年之后,移民率仍然很高,但移民的人数却在波动。2007年移民突然减少,2008年达到了大约420,000人的峰值。结果,2007年净移民人数上升到24万,但在2008年又回落到16万左右。(159)
以上就是关于“两个图表混合的雅思作文如何答”的内容,更多精彩内容,请关注雅思频道!

扫码添加助教号
免费获取最新雅思口语题库
